OfficeReports Analytics 6.0 review
DownloadCreate tables and charts in Excel, including statistical analysis
|

|
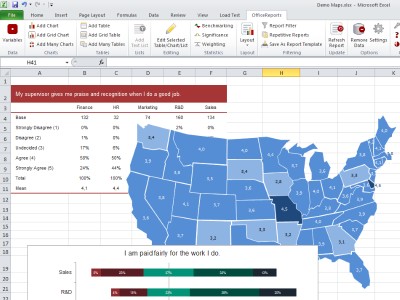
OfficeReports makes it easy to create charts, tables in Excel in the layout you like! No matter if you have your data in Excel or SPSS format, or would like to connect directly to your SurveyMonkey survey. OfficeReports has all the functionality for the statistical analysis, including t-Test and Z-test.
OfficeReports Analytics 6.0 search tags excel powerpoint word charts crosstabs tables report infographics report powerpoint survey

