e!Sankey pro 4.5 review
DownloadA software tool to visualize material, energy or cost flows with Sankey diagrams
|

|
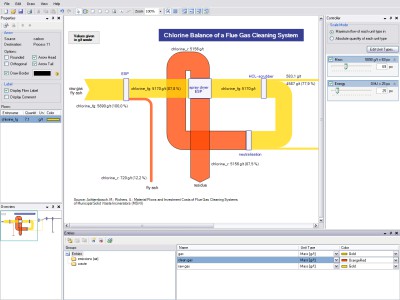
A software to easily create Sankey diagrams. A Sankey diagram is a directional flow chart where the width of the arrows is proportional to the flow quantity. Sankey diagrams are a useful way of visualizing material flows, energy or costs. If you are a chemical, environmental or process engineer, a professional in quality management, logistics or finance, you can use e!Sankey diagrams to display flow quantities in production systems. Excel import.
e!Sankey pro 4.5 keywords sankey flow diagram chart graph graphics visualise visualize visualisation visualization arrow node

