Magic Charts 2.7beta2 review
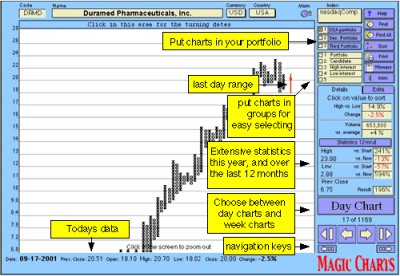
DownloadMagic Charts is a tool to easily follow the stock market using Point and Figure charts.
|

|
Magic Charts is a tool to easily follow the stock market using Point and Figure charts.
Our sample portfolio had a 102% gain in 2001! We send an updated copy of the sample portfolio everyday along with the updated charts.
We have charts of US stocks, US mutual funds, ETFs iShares, and European stocks.
Limitations:
30 days trial.
Magic Charts 2.7beta2 keywords

